Durban Neighborhood - 5/2016
Reload page to see different photo.

All web site content except where otherwise noted: ©2026 Bill Bushnell
Background texture courtesy of Iridia's Backgrounds.
Please send comments or questions to the .
E-Bike Items for Sale - Here's a photo journal of items that I'm trying to clear out of my workshop.
Shipping is $10 or (actual shipping charges + (optional) insurance charges + delivery confirmation fee, if any), whichever is greater. I will try to find cheapest shipping option or will ship according to your carrier of preference. Please note that batteries can only be shipped by UPS Ground.
Most items are new or lightly-used. A few items that have been used moderately or heavily are noted. Capacity of used batteries has been measured and noted. If you think my item pricing is off or you're buying multiple items, please make me an offer.
I will test everything electronic to make sure it works before I send it out, so I am selling everything "as is". But, if you buy an item that is dead on arrival, damaged in shipment, or you believe you got a raw deal, please contact me as soon as possible so we can work out a solution. I am not making a profit on this and am more interested in seeing this surplus hardware find a home with other enthusiasts where it will get used instead of collecting dust in my workshop.
Don't forget to take a look at my bike items for sale.
Contact me at the following . It will help if you include the links to photos of the items that interest you. All prices are in US Dollars.
Power-Assisted Rotator Pursuit Build - An album of pictures showing the assembly of a power-assisted Rotator Pursuit starting with the tiny, 3-lb Transmagnetics 400 watt motor, upgrading to the BMC "600-watt" motor controlled externally, and then using a direct-drive hub motor with full regeneration capability. This album is subject to occasional updates as the project progresses.
Power-Assisted Easy Racers Gold Rush Build - An album of pictures showing the assembly of a power-assisted Gold Rush using a Cyclone/Headline motor in various gearing configurations, at first through the left crank, later as a mid-drive, then through the right crank using a modified BMC motor driven with an external controller that works well for off-road or steep hills. My latest system uses a quiet direct-drive rear hub motor with full regeneration capability and is the system I currently prefer. This album is subject to occasional updates as the project progresses.
Old vs. New Bike Chain - This album shows the elongation of an old, worn bike chain next to a new bike chain when both are placed against a ruler (engineer's scale).
When I check wear I use an engineer's scale rather than a ruler because I like to use the "20" scale and compare over a full 12 inches. Using the "20" scale makes it easier to spot lesser degrees of wear, and, since the engineer's scale has a margin at both ends rather than being abruptly cut off, it's easier to keep the chain aligned flat against the scale over the full 12 inches.
The old chain had 142 links, was used on the rear of my Power Pursuit (transfering both human and motor power), and had 3586mi (5771km) on it.
Note that the ruler was straight, even though it appears to be bent in the photos due to lens distortion.
Schottky Diode Battery Combiner - A photo tour of a very small project, the implementation of low-drop Schottky diodes to combine the capacities of two to four batteries. The diodes used are ST Micro STPS60L30CW, 30-volt, 60-amp.
A key feature of this particular diode is that the forward voltage drop is very low, around 0.35v, so they don't get more than slightly warm under heavy load. A disadvantage is that they cannot be used with batteries that see greater than 30 volts (at full charge). So, only 24-volt batteries (nominal) can be used.
The circuit is wired with common battery negative, common cathode positive, and each battery's positive wired to the anode of each diode. The diodes are isolated and the case is floating to prevent accidental short circuits.
Cyclone LiFePO4 Battery - A photo tour of the 24 volt, 10 amp-hour LiFePO4 battery sold by Cyclone Taiwan.
Compact Battery Panniers - A photo tour of a pair of panniers designed to hold two U1 batteries. The panniers were made by Inertia Designs of Santa Barbara, CA.
Infineon Controller - Photos of the interior of a 12-FET Infineon controller adjusted for use between 20 and 60 volts and to a limit of 55A. The controller in the first three photos was modified to these specs by Grin Technologies. The second three photos show a similar controller from Edward Lyen that uses additional features such as a separate cruise control, a three-speed switch, includes programmability, and uses IRFB3077 MOSFETs for lowest loss at lower voltages (less than 63 volts).
Cyclone Motor - A photo tour of the inside of the Headline/Cyclone motor, controller, and planetary gearbox.
Cyclone Double Freewheel - A photo tour of the double freewheel that can be mounted to the gearbox output shaft. Note that the double freewheel can only be used on certain gearboxes that have a smooth output shaft.
Rotator Power Pursuit Mid-Drive - A photo tour of the mid-drive shaft and its components as used on my Rotator Power Pursuit. Variations are shown for both Cyclone/Headline motor where the motor freewheel is on the motor/gearbox shaft, and for the Transmagnetics motor or any other motor where the freewheel for the motor is on the mid-drive shaft.
Lashout Planetary Gearbox - This gearbox is used in a variety of electric bike motor kits, most notably with the Currie kit that uses the "300 watt" and "600 watt" MAC-BMC motors. This gearbox is also compatible with the "400 watt" Kollmorgen motor. A newer version of this gearbox is available with a thicker pinion shaft and 19t output sprocket.
MAC-BMC 600-watt Motor - I bought this non-working motor for $15 to see if I could use it as a stand-alone motor. It came out of a Synergy Drive kit. I was able to bypass the internal controller and hook up to an external controller. I was able to spin the motor smoothly, but the efficiency was poor, about 40%, and the controller got warm when free-spinning the motor and very hot under load. Freespin RPM at 25 volts is 2900 RPM. Either the magnets are damaged (partially degaussed), or my controller isn't compatible. In any case it was in interesting exercise that didn't cost too much.
Update: After receiving some advice on a couple of online forums I undertook to reposition the Hall sensors inside the motor. The idea was simple, find the position for the Hall sensors that resulted in lowest freespin power. The position I found was exactly 1/2 of a stator tooth in the clockwise direction.
Unfortunately, I couldn't reuse the stock Hall sensor board and had to replace two of the Hall devices after trying different positions and breaking their leads from fatigue. Reusing the board in the new position caused it to sit too high on the back of the stator, interfering with the rotor. To get the Halls to fit I had to grind off the end of three of the teeth to make room for the devices.
MAC-BMC 300-watt Motor - This is the little brother of the 600-watt motor shown in the album above. The motor is configured like the 600-watt version with a few differences: The stator teeth and magnet ring are half as deep, and the motor shaft is 10mm diameter, instead of 12mm. The tip of the shaft on both motors is 8mm with a "D" flat.
Transmagnetics 4-inch 24-volt motor - This motor was made by Transmagnetics ca. 2000-2004. It is designed to run at 24 volts, is my most efficient motor at low power levels, especially when used with Transmagnetics' own controller, and weighs only 3 lbs.
One disadvantage of this motor is that it produces a resonance when it is spinning near its efficiency peak that sounds a little like fingernails on the blackboard. As annoying as the noise is, it is a good indicator of when the motor is running at or near its efficiency peak. One doesn't have to watch the instruments, just use one's ears.
Another weakness of the motor is a shaft that is too thin and prone to damage and as a result of the thin shaft, an under-spec'ed faceplate bearing that wears prematurely. The shaft is a constant 8mm and the bearing a 608Z, which is too small for the typical loads. The newer 48-volt 4-inch; motor corrects these deficiencies, although the newer motor is much less efficient at 24 volts.
Transmagnetics 4-inch 48-volt motor - This is a motor made by Transmagnetics ca. 2008. It is larger than the previous 4-inch; motor, using slightly larger magnets (bolted to the rotor), and more windings on the stator so that its Kv (rpm/volt) is about 55% that of the earlier 4-inch motor. This motor is designed to run at 48 volts but works surprisingly well at 36 volts if power requirements are moderate. At 24 volts efficiency drops off, especially at partial throttle. DC resistance of each power phase is about 230 mOhms, about 3x-6x that of the Headline and 24-volt Transmagnetics motors.
Mars ME026 Axial Flux motor - This album contains several photos of the exterior of the Mars ME026 Axial Flux motor and its installation on my bike/test rig. Since I had borrowed this motor to test its efficiency I had to replace the power and Hall connectors as seen, but I did not otherwise take it apart to examine or to photograph the interior.
StokeMonkey Installation and Ping Battery - These photos show the StokeMonkey kit installed on a Surly Long Haul Trucker and the associated Ping Battery that is being used with this particular kit. The StokeMonkey kit is unusual in at least two ways: (1) It uses a hub motor to (2) drive a left crank.
The controller looks like a Crystalyte controller customized for StokeMonkey. I did not open the box to confirm my suspicion, though, as the bike was on loan from a friend.
The battery is a Ping Battery 36v/15Ah. Two of them are used with this bike.
Easy Racers Gold Rush with front fairing and wraparound sock. This is similar to the stock Easy Racers Gold Rush with front fairing and bodysock.
Rotator Pursuit with coroplast side and tail fairing, lycra cockpit cover, front half-wheel cover, and open bottom
Cyclone 360 - 360-watt motor using 24-volt internal controller, sold as part of "360-watt kit".
Cyclone 360 (timing study) - 360-watt motor using 24-volt internal controller, sold as part of "360-watt kit". This chart shows curves at -1.5, 0, and +1.5 degrees of timing advance.
Cyclone 500 - 500-watt motor using 24-volt internal controller, sold as part of "500-watt kit".
Cyclone 650 - Raw motor using 24-volt external controller, sold as part of "650-watt kit". The motor used in this test was fine-tuned for neutral timing.
Cyclone 900 - Raw motor using 36-volt external controller, sold as part of "900-watt kit". The motor used in this test was fine-tuned for neutral timing. Controller was modified to work between 24 and 48 volts nominal. Tests were done at 24, 36, and 48 volts at full- and half-throttle.
Cyclone 1200 - Raw motor using 48-volt external controller, sold as part of "1200-watt kit". The motor used in this test was fine-tuned for neutral timing.
MAC-BMC 600-watt motor (M1) driven by Headline and Transmagnetics controllers - Raw motor (internal controller bypassed) driven by an external controller. Controllers used are Headline (at 24, 36, and 48 volts) and Transmagnetics (at 24 volts). This is the 600-watt version of the MAC-BMC motor used in the Currie, Lashout, and Synergy electric bike kits, not the hub motor. The motor used in this test was fine-tuned for clockwise spinning. Note that the half-throttle efficiency of the Transmagnetics controller is higher than that of the Headline controller.
MAC-BMC 600-watt motor (M2) driven by Headline controller - Raw motor (internal controller bypassed) driven by a Headline controller. This is the 600-watt version of the MAC-BMC motor used in the Currie, Lashout, and Synergy electric bike kits, not the hub motor. The motor used in this test was fine-tuned for clockwise spinning. Curves are given for driving voltage of 24, 36, and 48 volts at both full-throttle and half-throttle and using both the stock composite magnet rotor and a custom N42 (Neodymium magnet) rotor, 12 curves altogether. Note that half-throttle efficiency is about 7-8% poorer than full-throttle efficiency.
MAC-BMC 600-watt motor (M4) driven by an Infineon controller - Raw motor (internal controller bypassed) driven by an Infineon controller. This is the 600-watt version of the MAC-BMC motor used in the Currie, Lashout, and Synergy electric bike kits, not the hub motor. The motor used in this test was fine-tuned for clockwise spinning. Curves are given for driving voltage of 24, 36, and 48 volts at both full-throttle and half-throttle and using both the stock composite magnet rotor and a custom N42 (Neodymium magnet) rotor, 12 curves altogether. Note that the Hall sensor position in the motor is different for the Infineon controller than for the Headline controller and that half-throttle efficiency is about 5% poorer than full-throttle efficiency.
MAC-BMC 600-watt motor (M1) driven by an Infineon controller - Raw motor (internal controller bypassed) driven by an Infineon controller. This is the 600-watt version of the MAC-BMC motor used in the Currie, Lashout, and Synergy electric bike kits, not the hub motor. The motor used in this test was fine-tuned for clockwise spinning and is the M1 motor instance (my first sample of this motor). The Halls were located on the trailing edge of the tooth prior to the gap 180 degrees from the stock Hall sensors. Curves are given for driving voltage of 24, 36, and 48 volts at both full-throttle and half-throttle and using the stock composite magnet rotor. These curves are show that the efficiency of this motor with this controller and Hall sensor positioning is almost always higher than for other motor/controller combinations.
MAC-BMC 600-watt motor (M5), Star winding, driven by an Infineon controller - Raw motor (internal controller bypassed) driven by an Infineon controller. This is the 600-watt version of the MAC-BMC motor, similar to that used in the Currie, Lashout, and Synergy electric bike kits, not the hub motor. The motor used in this test was fine-tuned for clockwise spinning and is wired as the other motors but connected in Wye (or Star), rather than in delta. Curves are given for driving voltage of 24, 36, and 48 volts at both full-throttle and half-throttle using the stock composite magnet rotor.
Comparing the efficiency curves with that of the M1 motor, Delta winding, shows that peak efficiency is about the same but the curve droops a bit at the high-power end of the curve. It is not surprising that high power efficiency is worse in Star than in Delta, as the current must pass through twice as much wire, leading to a doubling of losses. One might conclude that using faster-spinning Delta connected motor with a greater gear reduction would be more efficient than Star connected with less gear reduction.
MAC-BMC 600-watt motor (M1) Gearbox Study - Three curves showing this motor (1) driven without a gearbox, (1) with the old Currie planetary gearbox (using 12mm output pinion shaft and 1/2" brass bushing on housing to support the end of the output shaft), and (3) with the newer Lashout planetary gearbox (using 18mm output pinion shaft and ball bearing on housing to support the end of the output shaft). It's clear that there is some efficiency loss when using a planetary gearbox, but some gearboxes are lossier than others. Both gearboxes use the same planetary gears internally. The main differences are the size of the output shaft and the support hardware on the end of the output shaft (bushing vs. bearing). The Lashout gearbox uses an 18mm shaft that allows for a stronger one-way bearing.
A couple things to note:
MAC-BMC 300-watt motor (M3) w/stock rotor, 16-pole - Raw motor (internal controller bypassed) using multi-voltage Headline external controller. This is the 300-watt version of the MAC-BMC motor used in the Currie, Lashout, and Synergy electric bike kits, not the hub motor. The motor used in this test was fine-tuned for clockwise spinning.
MAC-BMC 300-watt motor (M3) w/N42SH Neodymium magnets, 20-pole - Raw motor (internal controller bypassed) using multi-voltage Headline external controller. This is the 300-watt version of the MAC-BMC motor used in the Currie, Lashout, and Synergy electric bike kits, not the hub motor with the substitution of a 20-pole N42SH rotor (stronger magnets) for the stock composite rotor magnet ring. The motor used in this test was fine-tuned for clockwise spinning. A comparison of these curves with those using the stock rotor shows that the stronger magnets do not yield higher peak efficiency--indeed they give lower efficiency at the peak--but do seem to give higher efficiency at the high end of the curve. Note that the Hall sensor positioning is different when using a 20-pole rotor than the stock 16-pole rotor.
Transmagnetics 4-inch 24-volt motor - This is a motor made by Transmagnetics ca. 2000-2004. It is the smallest and lightest motor I have used for hybrid-electric projects, weighing less than 3 lbs. It's the most efficient motor when used at relatively low power levels most of the time.
Transmagnetics 4-inch 48-volt motor - This is a motor made by Transmagnetics ca. 2008. It is larger than the previous 4-inch motor, using slightly larger magnets (bolted to the rotor), and more windings on the stator so that its Kv is about 55% that of the earlier 4-inch motor. This motor is designed to run at 48 volts but works surprisingly well at 36 volts if power requirements are moderate. At 24 volts efficiency drops off, especially at partial throttle. DC resistance of each power phase is about 230 mOhms, about 3x-6x that of the other motors.
Mars ME026 Axial Flux motor - This motor originally designed for use in a floor-scrubber is being considered as a robust, low-Kv motor for an ebike. Kv in the 24 to 48 volt range was measured around 90 when cold, and close to 100 when hot. Weight of the motor is about 2.9 kg; weight of the gearbox is about 0.9 kg. I was disappointed that the efficiency of this motor was not as good as I expected. Compared to the Headline/Cyclone motor (shown above) that was tested in a similar configuration (same number of gear stages and same planetary gearbox), its efficiency was slightly worse. The motor does get hot at high power, too hot to touch, especially on the back plate. Efficiency might be improved slightly by tuning the Hall sensor position to better match the controller, but that was out of the scope of this test.
StokeMonkey Kit - With some help from Don Pardo, who brought the bike over to my workshop to be tested and helped take notes during the test, we tested the stock configuration of the StokeMonkey installed on a Surly Long Haul Trucker driven by a Ping Battery 36v/15Ah LiFePO4 battery.
When I first took an interest in hybrid-electric bikes I had noted some of the design features of the StokeMonkey system and sought to copy some of them on my second e-bike installation, in particular, the left crank drive as that would be easy to do on my Gold Rush and would avoid the troubles I had heard others have with unreliable freewheeling cranks. I didn't buy the StokeMonkey at the time because the large hub motor was too big to fit conveniently on my frame and the 36-volt requirement would make battery placement awkward. I was at the time using 12v lead-acid batteries, so 36 volts would require fastening three to the bike's frame, but a 24-volt system only required two that could be fastened in a way that balanced the weight. Yet, I had always wanted to test this system to see how it performed.
The system appears to work well if one can live with two unusual characteristics: (1) The motor is a hub motor that functions as an un-housed outrunner adapted (2) to drive the left crank. This means that the motor itself spins, that only the axle is held fast and that the cranks are driven when the motor is used; there is no freewheeling. So, one should take care not to let clothing or other items to become entangled in the motor, and one always must at a minimum go through the pedaling motion when using this system.
The system's best feature is its relative absence of excess motor or gear noise. Only a slight hum and clicking of the chain rolling on and off the sprocket teeth at low speed can be heard, and then only at low speed. At higher speed wind noise dominates.
The StokeMonkey kit is apparently delivered with a customized CycleAnalyst that is missing a few usual features but has a few added features such as a 20mph speed limit and a requirement that the front wheel must be spinning for the motor to run.
We tested the motor at 36 volts nominal system voltage at both full throttle and half throttle from no load up to maximum load before the motor stalled or power output began to decline with increasing input power. The motor appeared to be limited by a controller with a relatively low current limit. I was tempted to test it with my 55A Infineon controller, but I decided I'd keep this a stock test and not risk damaging anything, since this was not my system.
During the test we observed no breakdown, no untoward noises, nor excessive heat buildup in the components, although the motor did get quite warm at the end of the full-throttle test under maximum load, it never got too hot to grasp indefinitely with a full hand.
We ran through the tests using the supplied customized CycleAnalyst and a calibrated DrainBrain I had used on my other motor tests. The calibration of the supplied CycleAnalyst appeared to be quite different from that of my DrainBrain, the latter showing roughly 7.5% lower wattage and 1.3% higher voltage (which means that the current calibration was off by nearly 9%).
To read power we used a PowerTap power measuring hub, the same PowerTap hub I've used on my other motor efficiency tests. The advertised accuracy of the PowerTap hub is within 1.5% and that of a (presumably calibrated) CycleAnalyst and DrainBrain within 3%.
I included efficiency curves measured with both the supplied CycleAnalyst and the calibrated DrainBrain. The DrainBrain-derived curves can be compared directly to the other efficiency tests on this page, but the CycleAnalyst curve is what we read directly off of the system as supplied.
Testing Lithium Battery Capacity - I have two hybrid-electric bikes and six batteries that I have labeled "S1" through "S6". For the kind of riding I do, mostly long rides (>100km), once or twice a week, riding one of two bikes, I do not put many cycles on the batteries over the course of a year. Batteries S1 - S4 each see around 50 cycles annually. Batteries S5 and S6 probably see 20-30 cycles annually. I aim to discharge to about 10% State of Charge (SoC) but in practice often discharge less and occasionally more. I've never hit BMS cut-off when riding, only when testing.
In spite of my light usage I observe a noticeable reduction of capacity, especially after the first year. Factors other than number of cycles such as depth of discharge and aging may play a role. To determine the degree of capacity reduction I experience with my batteries given how I use them since they were purchased in 2014, I test their capacity annually each winter.
Each battery is built using the Samsung INFR18650-29E cell in a "7s" (7 cells in series) configuration. Batteries S1 through S4 consist of nine parallel cells per cell bank, "9p", and each of these cell banks is then wired in series to arrive at the 7s (seven in series) configuration. The shorthand would be "7s9p". Batteries S5 and S6 are configured as "7s12p". Each battery is regulated by a BMS that prevents the user from overcharging or undercharging any cell.
In normal practice I charge my batteries to 4.1 volts per cell and aim to discharge to around 10% State of Charge (SoC) with occasional deeper discharges but more often shallower discharges, although for these tests I charged to 4.2 volts per cell and discharged until the BMS cut off the discharge current when the first cell was drawn down to 2.75 volts under load.
For each battery I performed a full discharge as described above into a resistive load that resulted in an 18 Amp draw at the top of charge and a 12 Amp draw at the bottom of charge. (Starting in 2018 I discharge at half that current as I believe that more accurately reflects the typical load on my batteries in use.) While discharging I tracked Amps-hour drawn and watts-hour drawn using the same DrainBrain (predecessor of the Cycle Analyst) year to year. At the same time I logged the voltage of each cell bank to assess the degree of cell voltage balance achieved in each battery and tuned these individually, if necessary, after running the test. I.e. The results below do not include the effect of any manual cell balancing I may have done after running a complete discharge on a battery.
The table below gives for each battery the Ah and Wh capacity in each year. I plan to test my batteries and to update this table annually.
I find it interesting that significant capacity is lost during the first year of use. Also, the Wh reduction is greater than the Ah reduction, suggesting that as the battery ages it spends more time discharging at a lower voltage. I am interested to learn if the capacity reduction gets smaller each year or stays roughly the same each year.
The variation of capacity lost over time could be due to a number of factors. Batteries S1-S4 are smaller and so are driven harder, at a higher per-cell current, than the larger S5 and S6 batteries. The number of cycles may be significant as by the end of year 2 S5 and S6 may have seen half the number of cycles as S1 through S4. Manufacturing variability is probably not significant as all six of these batteries were constructed from the same batch of cells.
In January 2017 I was able to recover "lost" capacity by performing manual cell balancing on most of my batteries. Even though my charge protocol prior to testing is to charge up to BMS cutoff and let the charger sit at a high voltage for at least 12 hours so that the BMS cell balancing function has time to address voltage imbalances between the cells, I discovered after concluding these balancing sessions that Cell 7 and occasionally Cell 6 and Cell 1 exhibited higher voltages than the other cells, quite consistently.
I'm not sure why this cell imbalance occurs, and why always Cell 7, the cell at the highest potential. I do know that after I manually bled current from Cell 7 and the other high cells, as much as a few hundred mAh each, so that their voltages were reduced to below the average cell voltage, I was able to increase the battery's overall capacity by as much as 10%.
Another trick I discovered to increase battery capacity is to charge the battery fully, until the BMS cuts off current. Then discharge the battery at several Amps for 5-15 seconds, using a dummy load if necessary. Then put the battery back on the charger at a low charge rate, say, 1-2 Amps instead of 4-8 Amps. I was able to recover about 8% of a battery's capcacity by doing a slow charge to top off the charge.
Fortunately, I had my batteries constructed with a JST-XH connector tapping each cell's voltage so that I could examine cell behavior individually and to charge/discharge each cell individually, if necessary. I have to wonder how many commercial e-bike batteries show reduced capacity due to cell imbalances caused by poor voltage balancing function in a battery's BMS. In the future I will add this manual cell balancing step prior to my annual capacity test. I hope that this critical step will extend the useful life of my rather substantial investment in batteries.
In the last few years as of this writing (early 2025) I've noticed that the capacity trend has been a gradual decline as expected. But I also have observed an increase of battery internal resistance by a factor of two or three (measured by the Cycle Analyst) compared to when the batteries were new. This increased resistance is disproportionate to the reduced capacity. In other words the resistance has been rising at a faster rate than the capacity has been declining. But the increasing internal resistance has an effect of denying me the full benefit of regenerative braking until the battery has been significantly discharged. The older batteries simply can't accept as high a charge current, so when they're above 80% State of Charge, a hard regen braking effort will send the battery voltage up to the maximum voltage allowed at which point my controller rolls back the braking effort (negative current) to prevent over-volting the battery.
| Trial: | BMC600, CW | BMC600, CCW | NC-M3006RC, CCW, typical regen | NC-M3006RC, CCW, maximal regen |
|---|---|---|---|---|
| Link to GPS track: | BMC600, CW | BMC600, CCW | NC-M3006RC, CCW, typical regen | NC-M3006RC, CCW, maximal regen |
| Bike Ridden: | Power Gold Rush | Power Gold Rush | Power Gold Rush | Power Gold Rush |
| Total Mass (kg): | 134 | 133 | 135 | 136 |
| Distance (km): | 73 | 73 | 73 | 73 |
| Nominal System Voltage: | 24 | 24 | 48 | 48 |
| Cumulative climbing (m): | 1000 | 1000 | 1000 | 1000 |
| Battery energy capacity (wh): | 1200 | 1200 | 1200 | 1200 |
| Battery energy consumed (wh): | 863.8 | 881.4 | 980.7 | 987.3 |
| Wh/km: | 11.8 | 12.1 | 12.8 | 12.2 |
| Battery Amps-Hour Used: | 33.76 | 34.46 | 19.00 | 19.28 |
| Regen Amps-Hour Produced: | 0.001 | 0.001 | 0.908 | 1.955 |
| Peak Forward Current (Amps): | 34.0 | 34.9 | 18.3 | 19.1 |
| Peak Regen Current (Amps): | 0.80 | 0.74 | 17.9 | 8.99 |
| Max. Exterior Motor Temp. (°C): | 52 | 46 | 73 | |
| Max. Interior Motor Temp. (°C): | 147 | 144 | ||
| Max. Exterior Controller Temp. (°C): | 42 | 28 | 39 | 34 |
| Total Time (hh:mi:ss): | 2:40:27 | 2:48:59 | 3:01:11 | 3:14:02 |
| Riding Time (hh:mi:ss): | 2:29:29 | 2:29:30 | 2:35:00 | 2:50:41 |
| Avg. Speed Moving (kph): | 29.3 | 29.3 | 28.2 | 25.6 |
| Max. Speed (kph): | 75.6 | 76.0 | 71.1 | 49.2 |
Hub Motor Hills Testing - After my first ride with a direct-drive hub motor I thought it would be best to conduct a more controlled experiment to assess the qualities of the hub motor and the effect it had on my riding.
My experiment would compare various statistics between different trials over the same course under the similar conditions using my existing geared motor, a BMC600, and a new Nine Continents NC-M3006RC direct-drive hub motor. Both motors would be driven by an external controller, a Lyen Mark II 12-FET "Infineon" or "Xie Chang" controller.
The BMC600 is an adapted BMC 600 watt scooter motor, a design that was used on single-speed systems that attached to the rear wheel and sold for many years by Currie, Lashout, Synergy, and others. The raw motor without internal controller is also used in the EcoSpeed kits. The motor used for these trials was salvaged from a Synergy kit. I removed its non-functional internal controller and re-wired it with new optimally-positioned Hall sensors, driven externally at 24 volts nominal system voltage.
The NC-M3006RC is one of the few that uses a freehub capable of accepting a 9- or 10-speed cassette. I chose the NC-M3006RC because its power capability was sufficient for my requirements, the price was not unreasonable, its maximum speed on flat ground under load on my bike was at least 50kph (at 48 volts), and its efficiency according to this simulator was 1-2% higher than other candidate motors. I felt that it was a good proxy for the direct-drive class of e-bike motors. I ran the NC-M3006RC on a 48-volt nominal system voltage.
I started by planning a route that was a little shorter than the La Honda loop of my first ride but that might have a better chance of illustrating differences when ridden in opposite directions. My chosen route was a loop I had first ridden as a young teenager in the mid-1970s, a 73-kilometer loop with 1000 meters of climbing that includes CA84, Skyline Blvd, and Page Mill Road, a few rolling hills, and some mostly-flat suburban riding to and from the bases of the climbs and descents. (See a map at one of the links in the table above.)
Ridden clockwise (CW), this loop climbs Page Mill Road, a stair-step climb that includes some steep pitches approaching 20%, but nothing steep sustained for longer than a kilometer. The clockwise route follows a descent along Skyline Blvd., followed by a consistent descent grade of 6% on CA84 down from the ridge and a few more rolling hills before returning to the 'burbs.
Ridden counter-clockwise (CCW) the ascents are gradual, nothing sustained over 6%, and only one short pitch at 9%. The descent of Page Mill Road provides many opportunities to exercise the system's regen braking capability.
The hardest part of conducting these trials was for me to sit on my bike for almost 400 kilometers altogether and either not pedal at all or "soft pedal" so that my freewheel was continually being overrun, not to exert any force on the pedals other than what was necessary to spin the cranks to keep the PAS throttle active. I found that the pedaling motion resulted in an unaccustomed "snap" at the bottom of the pedal stroke that after a few thousand times pulled the adductor muscles in my legs. They were quite sore afterward!
The feel of each of these motor systems is different. The BMC600 can be geared according to conditions. Lots of torque is available at low speed, but as speed increases, the torque decreases somewhat mainly because up-shifting to a higher gear takes a little time. The acceleration is not seamless. The NC-M3006RC feels slow off the line, but as speed increases so does torque until it reaches its equilibrium speed for the throttle setting. It feels seamless and uninterrupted with the NC-M3006RC.
I tried my best to keep a constant weight on the bike for each trial. I did not want to remove my geared motor or the special cranks that I use with this motor, so to compensate for the additional weight the hub motor would have to push, I carried extra batteries (disconnected from the system) and extra water when I ran the trials with the BMC600. This still left the hub motor trials pulling slightly more weight, but I don't think the 2-3 kg difference is significant. The BMC600 trials were run with a standard rear wheel so that there would be no passive drag from the idle hub motor.
On the bike I limited my power to 750 watts and my speed under power to 20 mph, consistent with the definition (in the USA) of an electric bicycle.
I used the same two 7s9p LiPo batteries for all trials. When running the BMC600 running at 24 volts nominal I wired the batteries in parallel; with the NC-M3006RC I wired them in series.
I carried with me an IR thermometer to measure the exterior temperature of the motor and controller after an interval of steep, slow climbing or heavy regen. Interior temperature of the NC-M6006RC was measured by a 10k NTC thermistor wired directly to a CycleAnalyst, version 3 (CAV3).
Weather for all trials was warm to cool, air temperature between 18C and 25C and no wind.
After the first two trials (1st and 2nd columns in the table above), each ridden in opposite directions on the loop, with the BMC600 I was amazed to see the same average speed and riding time within 1 second. Because the BMC600 is geared and uses clutches and freewheels, there is no regen capability. Any regen Ah is due to the inertia of the motor stopping. The higher watt-hours consumed riding CCW can probably be attributed spending more time under power moving at a higher average speed given the power limitation of 750 watts.
When I ran the clockwise trial with the NC-M3006RC, the motor could not get me up Page Mill Road. I had to pedal it on all the steep stuff to keep it from stalling, and that assistance was enough to invalidate the trial. To avoid confusion I did not include the data from my first trial with the NC-M3006RC.
My second trial with the NC-M3006RC (3rd column in the table above) had me riding in the same style that I ride with my geared motor. Descents were taken as fast as gravity and the curves in the road allow. Instead of using my rear brake to trim my speed, I used regen. I also noticed regen occurring unbidden when my speed exceeded about 56 kph. I understand this was due to the rectified voltage of the spinning motor exceeding my battery voltage at the time, creating a natural regen effect. At one time I enjoyed seeing how fast I could go on a steep descent, but now I welcome the blunting effect this has on my maximum speed. The regen recaptures some energy that would otherwise by lost to air friction while at the same time exposing me to slightly less risk due to high speed. At its highest I briefly saw 900 watts of regen when I was descending one steep drop at 71 kph. This is getting close to the 1C peak charge current advisable for my batteries, so if speed goes much higher I'd need to use the friction brake. At the bottom of Page Mill the motor internal temperature was 147C. In all trials with the NC-M3006RC I saw my highest temperature after a long regen session.
My third trial with the NC-M3006RC (4th column table above) had me taking every opportunity to use regen braking. The idea was not to let my speed exceed 32 kph on the downhills. This protocol would capture more of my potential energy in regeneration rather than scrubbing it off to aero losses. On this trial I was able to descend all of Page Mill Road without touching my friction brake. The experience wasn't as fun as descending faster, but it was illustrative. There are times when a slow descent like this might be appropriate such as descending on a wet or slick road. At the bottom, the internal motor temperature was 144C, not quite as hot as when I descended faster with higher regen power peaks but for shorter duration.
The geared motor is still the most efficient overall, and if I wish to climb steep grades, climb slowly or with limited power, it's the only way that gives me optimal efficiency. With the hub motor I need to keep the speed above 15 kph for good efficiency, and above 10 kph to avoid bogging down and stalling. On a steep enough grade even 10kph would require too much power to sustain forward motion.
On the counter-clockwise loop with its moderate uphill grades the NC-M3006RC used about 11% more energy (980.7 / 881.4) than the BMC600 not including the effect of regeneration. If I include the energy captured during regen, then the NC-M3006RC used about 6% more energy (12.8 / 12.1). And, if I include the energy captured during aggressive regen, then the NC-M3006RC used about 1% more energy (12.2 / 12.1). The efficiencies were a good deal closer than the 15-20% I expected.
My main disappointment was discovering that the NC-M3006RC was not able to get me up the steep grades without my pedaling assistance.
Since the efficiency difference on this hilly course was less than I expected, I plan to run another trial on a flat course. On a flat course I expect the hub motor to be as or a little more efficient overall than the geared motor system.
Although the focus of this experiment was on efficiency, there are other pluses and minuses for each style of drive system that are worth reviewing here.
Advantages of mid- or crank-drive geared motor system:
Advantages of a direct-drive hub motor system:
| Link to Map: | Course 1, Infineon | Course 1, ASI | Course 2, Infineon | Course 2, ASI |
|---|---|---|---|---|
| Bike Ridden: | Power Pursuit F3 | Power Pursuit F3 | Power Pursuit F3 | Power Pursuit F3 |
| Total Mass (kg): | 136 | 136 | 136 | 136 |
| Distance (km): | 73 | 73 | 62 | 62 |
| Nominal System Voltage: | 48 | 48 | 48 | 48 |
| Cumulative climbing (m): | 1180 | 1180 | 1060 | 1060 |
| Battery energy capacity (wh): | 1600 | 1600 | 1600 | 1600 |
| Battery energy consumed (wh): | 909.3 | 878.9 | 1022.0 | 877.4 |
| Wh/km: | 11.6 | 10.5 | 15.5 | 12.2 |
| Battery Amps-Hour Used: | 17.6 | 16.7 | 19.8 | 16.7 |
| Regen Amps-Hour Produced: | 1.3 | 2.3 | 1.2 | 2.3 |
| Peak Forward Current (Amps): | 17.1 | 19.1 | 21.5 | 19.7 |
| Peak Regen Current (Amps): | 18.8 | 29.6 | 17.3 | 31.1 |
| Max. Motor Temp. when driving (°C): | 117 | 108 | 136 | 136 |
| Max. Motor Temp. in regen (°C): | 143 | 92 | 145 | 109 |
| Ambient Temperature (°C): | 20-25 | 20-25 | 5-10 | 20-25 |
| Total Time (hh:mi:ss): | 2:51:35 | 2:38:11 | 3:10:43 | 2:41:18 |
| Riding Time (hh:mi:ss): | 2:35:32 | 2:28:20 | 2:30:18 | 2:17:07 |
| Avg. Speed Moving (kph): | 27.9 | 29.3 | 24.6 | 27.1 |
| Max. Speed (kph): | 72.1 | 68.0 | 70.0 | 68.6 |
Comparing Infineon to ASI Controller - Summary: When driving a relatively inexpensive Nine Continents M3006RC direct-drive (DD) hub motor the ASI BAC2000 controller offers at least two measurable advantages over an Infineon controller with similar specifications:
After getting my ASI controller installed and configured on one of my e-bikes, I decided to conduct an experiment to see if this new controller offered any advantages over the inexpensive Infineon style controller.
One poster on an Endless-sphere forum discovered improved efficiency of his ASI controller over his Infineon. I sought to confirm this for myself.
The Infineon controller I used was a model customized by Edward Lyen, a "Lyen MK II 12-FET", a variant of the Chinese controller design found commonly on e-bikes.
I conducted two trials each over two different but similar courses. For each course Trial 1 was ridden with the Infineon controller, and Trial 2 was ridden with the ASI controller. The bike and motor were the same in all cases, a long wheelbase faired recumbent that I call the Power Pursuit F3. Bike and rider weight was 136 kg. Rider did not pedal other than to attempt to stay warm spinning the cranks while the motor overran the freewheel. There was no pedal to wheel engagement at any time during a trial. The CA3 on the bike was configured with limits of 750 watts motor input power and maximum 32 kph speed while under motor power.
I was able to run my trials on days with similar weather and little wind, except for the Course 2 trial with the Infineon controller where the weather was colder than for the other trials. Given the results one might conclude that had I run this trial on a warmer day the results might have shown an even greater difference between the Infineon and ASI controllers.
How and when regen is used is the hardest parameter to control. Although there is no way I can prove to myself that I requested the same amount of regen in each trial, I made a good-faith effort to be impartial in my application of regen. That the trials with the same controller over different courses (but same major descent) show similar amounts of regen (Regen Amps-Hour) suggest that I succeeded in riding these in a similar manner.
The longer Course 1 offered climbing that remained below 6% average grade other than some short sections that approached 10%. This course was chosen so that the DD hub motor would not stall or overheat on any part of the climbing.
The shorter Course 2 offered an extended climb of 7.0-7.5% average grade. I expected the climbing on Course 2 to present a challenge to this DD hub motor.
Both courses shared the same descent back into town, although Course 2 takes a slightly shorter and steeper option at the bottom, an option that could overheat the motor in regen.
It's clear from the data that the ASI controller drives this motor more efficiently than the Infineon controller. On Course 1 both controllers were able to drive the bike up the hill without stalling or overheating, but energy consumed (wh) was 3.5% lower with the ASI controller. Accounting for regen (wh/km), the ASI controller used 9.5% less energy than the Infineon controller.
The differences between the two controllers became more pronounced over Course 2.
With the Infineon controller on Course 2 the motor overheated four times on the upper half of the climb. I considered the motor overheating when its coils reached a temperature of 136C. Each time the motor overheated I stopped by the road and waited for the coils to cool to 95C before resuming. With the ASI controller the motor overheated twice, and each time I stopped until the coils cooled to 95C before resuming.
On Course 2 the ASI controller pulled 14% less energy (wh) from the battery. Accounting for regen, net energy consumption was 21% lower (wh/km) with the ASI controller. This is a huge difference.
It appears that the steeper the uphill terrain, the greater the difference in efficiency between the two controllers. On Course 1 the ASI with the DD hub motor may be more efficient overall than the Infineon with my crank-drive BMC600 geared motor. Compare Course 1 data with data in column 2, "BMC600, CCW", in the prior article above, but keep in mind that those trials were run on a slightly lighter but less-aerodynamic bike, so a direct comparison is not possible. Yet it's clear that at reasonable grades (e.g. < 6%), one can run this DD hub motor driven by an advanced controller such as the ASI and maintain good efficiency. By adding one's robust pedaling effort to the mix the upper bound for "reasonable grade" may increase to 8-12%, including all but the steepest mountain roads.
Although the motor still overheated on Course 2 with the ASI controller, it did so less quickly than with the Infineon controller. On Course 1 the driving motor under control of the ASI reached a maximum temperature 7% lower than the maximum temperature reached with the Infineon.
In regen the temperature differences were greater, the ASI-controlled motor rising to a maximum temperature that was 36% lower (Course 1) and 25% lower (Course 2) than with the Infineon controller.
When driven or driving this DD hub motor ran more quietly with the ASI controller than with the Infineon, but it was not completely silent as some users have reported. Always there was a slight audible hum, amplified I suspect by my tailbox that acts like a poorly-tuned resonator. The hum was loudest near 20 kph, becoming less intense at lower or higher speeds. With the Infineon controller the motor buzzed when driving, the buzzing becoming noticeably loud at lower speeds and higher power.
Neither controller became more than slightly warm to the touch of its heatsink during any of these trials.
Conclusion: I am pleased with the performance and relative efficiency of the ASI controller when driving the Nine Continents DD hub motor. I intend to ride with this configuration for a while longer.
| Link to Map: | Course 1, no Statorade | Course 1, Statorade | Course 2, no Statorade | Course 2, Statorade |
|---|---|---|---|---|
| Distance (km): | 73 | 73 | 62 | 62 |
| Nominal System Voltage: | 48 | 48 | 48 | 48 |
| Cumulative climbing (m): | 1180 | 1180 | 1060 | 1060 |
| Battery energy capacity (wh): | 1600 | 1600 | 1600 | 1600 |
| Battery energy consumed (wh): | 878.9 | 875.8 | 877.4 | 898.8 |
| Wh/km: | 10.5 | 10.2 | 12.2 | 12.6 |
| Battery Amps-Hour Used: | 16.7 | 16.6 | 16.7 | 17.2 |
| Regen Amps-Hour Produced: | 2.3 | 2.3 | 2.3 | 2.2 |
| Peak Forward Current (Amps): | 19.1 | 18.5 | 19.7 | 22.2 |
| Peak Regen Current (Amps): | 29.6 | 30.1 | 31.1 | 31.2 |
| Max. Motor Temp. when driving (°C): | 108 | 74 | 136 | 118 |
| Max. Motor Temp. in regen (°C): | 92 | 64 | 109 | 73 |
| Ambient Temperature (°C): | 20-25 | 20-25 | 20-25 | 20-25 |
| Total Time (hh:mi:ss): | 2:38:11 | 2:46:38 | 2:41:18 | 2:40:16 |
| Riding Time (hh:mi:ss): | 2:28:20 | 2:31:10 | 2:17:07 | 2:19:16 |
| Avg. Speed Moving (kph): | 29.3 | 28.8 | 27.1 | 26.7 |
| Max. Speed (kph): | 68.0 | 68.4 | 68.6 | 68.4 |
Statorade Tests - Statorade is a high-temperature ferrofluid sold by Grin Technologies and is applied to the gap between the rotor magnets and stator and retained by the magnetic field of the magnets. Statorade improves the heat-shedding ability of a direct-drive hub motor (or any outrunner motor where the outside of the runner is directly exposed to ambient air) by creating a heat path from the stator to the magnets and hence to the outer shell of the rotor exposed to ambient air, allowing the motor to run at higher load without overheating or to run at excess load for longer before overheating. (Further discussion of motor cooling using ferrofluids can be read on the Endless-Sphere forums here.
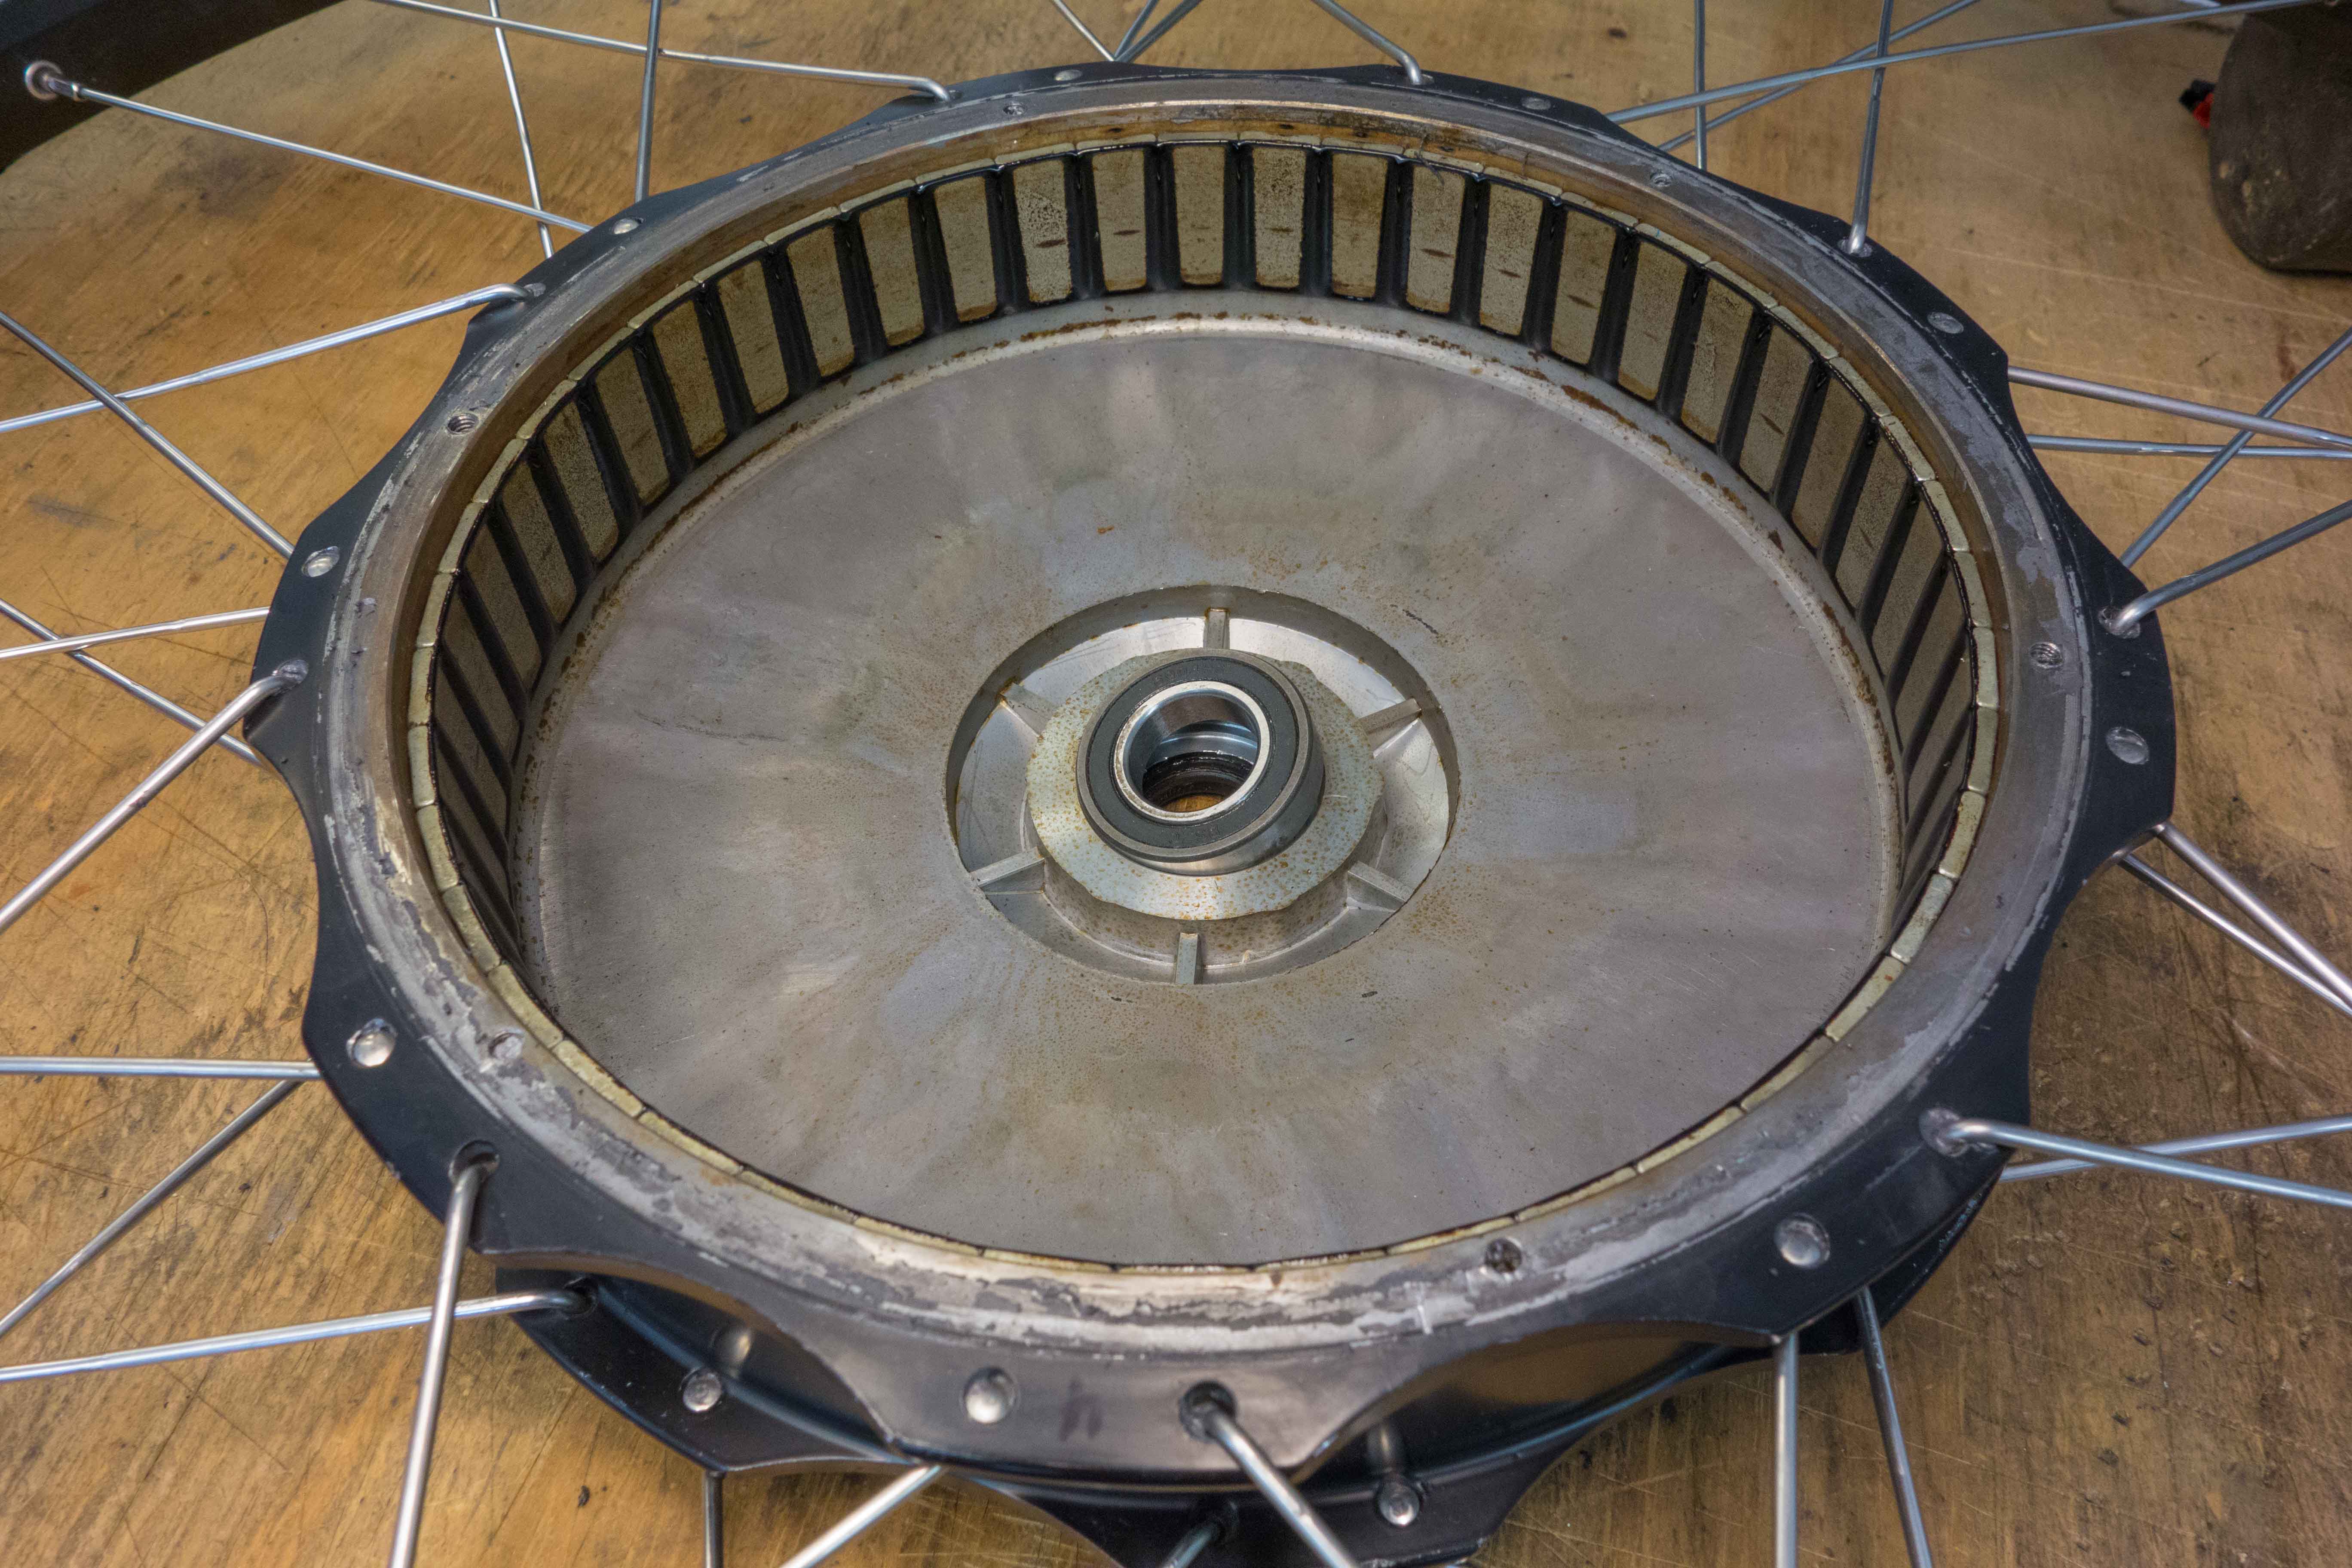
Nine Continents M3006RC direct-drive hub motor rotor with 6mL of Statorade (collected around the magnets.)
Statorade imposes a slight additional drag that is noticeable when pedaling without applying motor power. In spite of this additional drag its use will yield a net improvement of efficiency when it prevents motor temperature from ever rising too high. (See Course 1 comparison.) When the motor is destined to overheat with or without Statorade and spends significant time at higher temperatures (e.g. ~100°C), efficiency is slightly worse. But, with Statorade the motor overheats more slowly, perhaps allowing one to crest a longer hill without forcing one to stop by the road to allow the motor to cool. (See Course 2 comparison.)
Four trials were ridden on two different courses, once each without Statorade applied to the motor, and once each with 6ml of Statorade applied. The motor (Nine Continents M3006RC), controller (ASI BAC2000), and bike (Power Pursuit F3) were the same between all trials. The trials were ridden under similar temperature and wind conditions.
Bike and rider weight was 136 kg. Rider did not pedal other than to attempt to stay warm spinning the cranks while the motor overran the freewheel. There was no pedal to wheel engagement at any time during a trial. The CA3 on the bike was configured with limits of 750 watts motor input power and maximum 32 kph speed while under motor power.
How and when regen is used is the hardest parameter to control. Although there is no way I can prove to myself that I requested the same amount of regen in each trial, I made a good-faith effort to be impartial in my application of regen while descending a familiar road. That the trials show similar amounts of regen (Regen Amps-Hour) suggest that I succeeded in riding these in a similar manner.
The longer Course 1 offered climbing that remained below 6% average grade other than some short sections that approached 10%. This course was chosen so that the DD hub motor would not overheat on any part of the climbing.
The shorter Course 2 offered an extended climb of 7.0-7.5% average grade. I expected the climbing on Course 2 to present a challenge to this DD hub motor.
Both courses shared the same descent back into town, although Course 2 takes a slightly shorter and steeper option at the bottom.
Before I applied Statorade I used an effective thermal rollback temperature range of 133°C to 140°C, where full power (750 watts) was permitted at 133°C and declined linearly to zero at 140°C. When I opened the motor to apply Statorade I discovered that one of the motor bearings (the one shown loose in the photo) had burned off all its grease and had to be replaced. For the Statorade trials and to prevent premature bearing failure in the future I reduced the effective thermal rollback range to 113°C to 120°C.
On Course 2, no Statorade, the motor overheated twice. Each time the operator stopped to allow the motor to cool to 95°C before resuming.
On Course 2, with Statorade, the motor entered thermal rollback (using the 113°C to 120°C thermal rollback range) near the summit of the climb. Power was rolled back to about 450 watts, but no cooling stop was required.
Using an IR thermometer it was discovered that the exterior motor temperature was consistently 15°C to 20°C cooler than the motor coil temperature. The highest exterior temperature was opposite the magnets, and the coolest at the sides.
Although the numbers don't show much decline in efficiency with the Statorade, my legs could feel the additional drag when the motor was un-powered. I opened the motor and removed more than half the Statorade, then realized that I hadn't left enough to bridge the gap between stator and rotor in a way that allowed for significant conduction of heat, so I then re-added Statorade to bring the total volume up to about 4mL.
With 4mL of Statorade in the motor, I had enough to get meaningful heat transfer, but the passive drag was much lower. I could still feel it, but it was slight, not much more than without Statorade. Even without Statorade the motor has some passive drag.
Table 2 shows the data from the five additional trials over Course 2 under the same conditions, except where noted.
Notes for each 4mL Statorade trial:
Cooler ambient temperature allows the motor to run longer above steady-state before thermal overload occurs. This could be seen in Trial 1. Wet roads and rain may also aid in motor cooling. Although on the test bike the motor is fairly well sheltered under the tailbox fairing, it did get occasionally splashed with water.
In Trial 2 ambient temperature was 5°C warmer than in Trial 1, and although the roads were wet, the motor did overheat near the top of the climb. That 5°C made a difference. During Trials 1 and 2 the south wind on the flat portion of the course caused about 50 wh more battery energy to be consumed.
Installing a new cockpit sock on the fairing made little or no measurable difference.
Running at 24 volts nominal system voltage was less efficient overall—energy consumed was roughly the same as other trials while average speed was lower—most likely to due increased I2R losses in the motor. But, cutting the system voltage in half by wiring two series-connected batteries in parallel on long descents may offer a way to insure that one captures maximal regen energy by enforcing a speed limit of about 32 kph. It's possible to accomplish the same thing with manually-invoked variable regen, but it's easy to let speed drift higher when attempting capture maximum energy manually and to lose more energy to aerodynamic friction.
Since the efficiency hit is small with Statorade in the motor but the heat-shedding ability greatly increased, I will leave 4mL of Statorade in my motor. It is not fun to be forced to stop by the road and to wait for several minutes for the motor to cool when it overheats on a climb. On easier climbs a small efficiency gain can be enjoyed that more than makes up for the losses due to added drag by keeping the motor running at a cooler temperature. An additional benefit is increased long-term reliability of the motor by operating within a lower temperature range.
| Trial 1 | Trial 2 | Trial 3 | Trial 4 | |
|---|---|---|---|---|
| Battery energy consumed (wh): | 891 | 894 | 867 | 815 |
| Wh/km: | 11.6 | 11.4 | 11.0 | 9.3 |
| Battery Amps-Hour Used: | 16.9 | 17.0 | 16.4 | 15.5 |
| Regen Amps-Hour Produced: | 3.26 | 3.36 | 3.58 | 4.49 |
| Max. Motor Temp. when driving (°C): | 103 | 102 | 100 | 73 |
| Max. Motor Temp. in regen (°C): | 109 | 85 | 75 | 69 |
| Avg. Speed Moving (kph): | 25.4 | 25.8 | 25.3 | 26.6 |
| Number of cool-down stops: | 8 | 3 | 0 | 0 |
| ISO wheel size: | 559 | 559 | 559 | 406 |
| Statorade: | no | yes | yes | ? |
| Hubsinks: | no | no | yes | yes |
Edge 1500 Testing - The Edge 1500 direct-drive hub motor was recently made available from LA E-Bike. The motor features a 35mm stator, thin laminations (.35mm), an aluminum stator, and a low price from a domesitc (USA) distributor, saving the hassle of expensive international shipping from China. Additional features include a single molded plug wiring harness that improves convenience when removing the wheel from the bike.
After I placed my order I received a motor without the advertised temperature sensor. Since shipping is a nuisance, I would have kept the motor and installed my own 10k NTC thermistor if the wiring harness had included the sixth wire, which it did not. (The other five wires are for the Hall signals, U, V, W, V+, and GND.) So, I had to return the first motor.
The second motor did include the sixth temperature sense wire, but resistance between it and ground was infinite. Upon opening the motor I discovered that the wire had been cut to the quick and that there was neither a thermistor installed nor any evidence of one having been installed. But, since the sixth wire was present and the motor was already open, I went ahead and installed my own thermistor, wedged and glued between the wire coils and the stator frame.
The motor can accept a 6-speed freewheel within the 135mm dropout width. But, my preferred 7-speed or larger freewheel requires using spacers and spreading the dropouts. The rear triangles of my bikes are stiff, and I have barely sufficient upper-body strength to spread the dropouts elastically† about 6mm when I install the wheel. Removing the wheel for routine maintenance is best avoided. To ease the inevitable flat tire repair I use Gaadi linear innertubes that can be replaced without removing the wheel from the dropouts.
After initially installing this motor on my bike I noticed during high power tests that torque could be increased further as current was increased. At high power (2-3 kilowatts) it had significantly more "pull" off the line than the Nine Continents M3006RC motor I had been using for the prior year. That said, I also noticed that the wiring harness and connector became quite warm, borderline hot, after these tests. I would not expect to run this motor continuously at such power levels. But, for brief spurts such as starting from a stop on a hill, the additional torque is welcome.
To better quantify the characteristics of the Edge 1500 and to study the effects of adding two specific heat-shedding features to the motor, Statorade and Hubsinks, I undertook three trials. A fourth trial was added a year later that tested this motor laced into a 406 rear wheel.
Each trial was conducted over the same course (See map.) in the same direction under similar weather conditions. For each trial I used the same bike, my Pursuit with F2 fairing, same total weight, the same ASI BAC2000 controller tuned to run optimally with this motor, and maximum power set to draw no more than 750 watts from the battery, somewhat lower than the legal e-bike limit in California that allows 750 "brake" watts, measured at the rear wheel.
While riding the course I did not engage pedaling to the rear wheel, although I nearly always soft-pedaled to stay warm, allowing the motor to overrun the freewheel. The motor alone produced all motive power. When descending I did my best to regenerate as much as I could and to keep descending speed between 32 and 40 kph where regenerated energy is maximized.
The test course features one nearly-continuous climb of 650 meters. The grade increases slightly toward its summit.
Most motors overheat at some point on the upper half of this climb, requiring a cool-down period. I conservatively define overheating as the interior motor temperature exceeding 100C. In practice I allow my motors to reach 120C, the maximum design temperature for most sealed bearings, before I cut all power, the controller rolling back power linearly between 100 and 120C. But, for testing I stopped beside the road to let the motor cool to 80C before resuming when its interior temperature reached 100C. These cooling stops were usually about 5 minutes duration.
I ran the tests in Trial order, starting with the bare motor for Trial 1. Then I added 4.6 mL of Statorade and ran Trial 2. For Trial 3 I installed a single set of Hubsinks.
I found that 4.6 mL of Statorade gave significant cooling on the Edge 1500 while only producing a barely-noticeable increase in freespinning power draw, a few watts, compared to the bare motor. The motor with its thin laminations features very little idle drag, and I didn't want to sacrifice that to gain additional cooling effect by injecting more Statorade into the stator-magnet gap. But, if I were planning to run the motor hard (>2 kilowatts) much of the time, I might consider injecting another 1-2 mL to increase the heat transfered from stator to outer shell.
Examination of the table reveals that most performance parameters changed little between the trials. Efficiency was similar. Although a slight trend toward greater efficiency with the addition of cooling aids is suggested, this may also be explained as being due to lower average speed, slightly different ambient temperature, or other variables I was unable to control precisely rather than the cooling methods under discussion. The one major change is the number of cooling stops required on the long climb.
With the bare motor I had to stop eight times on the climb to allow the motor to cool. With 4.6mL of Statorade, the number of stops was reduced to three. And, after adding Hubsinks I did not have to stop, although the motor did just reach 100C as I crested the summit of the climb!
On a more subjective level I observed the motor temperature rise more slowly with the addition of Statorade and more slowly yet with the addition of Hubsinks. Motor cooling was similarly improved as I added each cooling aid.
In normal use (while adding pedal power, too) I have not overheated the motor on any of the climbs in my area, some of which exceed 1000 meters. The highest peak temperature I have observed has been under 100C.
With Statorade and Hubsinks a direct-drive hub motor such as the Edge 1500 becomes practical for those riding in hilly areas, especially if short bursts of power are available from one's controller for occasional high-torque starting.
With these cooling aids and due to the ASI controller's efficient implementation of regeneration, I see roughly 12% overall efficiency increase with the direct-drive hub motor compared to my geared crank-drive motor, even on hilly courses.
Other benefits include not having to worry about overheating my brakes on long twisty descents—a problem that has plagued me for many years—and nearly silent operation—the Edge 1500 makes a soft whirring noise when driving or a low hum when driven into hard regeneration.
Since I use both forward and reverse (regeneration) torque on my direct-drive hub motors up to about 35 Amps in either direction, I have had a problem with axle nuts coming loose. Even after tightening the nuts up to 80 Nm, they would still work loose after a few hundred miles. I use Doc's Ultimate Torque Arms that are made from hardened steel, so perhaps standard lock nuts and washers are unable to get any bite into the material. But, since I started using Nord-Lock washers I have not had an axle nut come loose when tightened to 80 Nm. The Nord-Locks appear to be just a little bit harder than Doc's torque arms, so they get enough bite not to rotate in use. I am still experimenting to discover the minimum torque sufficient to maintain long-term axle nut tightness, but I have also started rotating Doc's Ultimate Torque Arms counter-clockwise on the dropout after the wheel axle is fully-seated in the dropout so as to take up any backlash at the axle as the motor transitions between driving and braking. This last step I have found to be the most effective to prevent axle nut loosening.
Although I'm happy with the Edge 1500 overall, especially after adding Statorade and Hubsinks, the motor could use a few improvements:
But, even without these improvements, the Edge 1500 motor is an excellent value.
About one year after I conducted the first three trials, I purchased another Edge1500 motor, identical to the one used for the first three trials, and laced it into an ISO 406 wheel, a wheel with about 80% circumference of an ISO 559 wheel. I initially installed Hubsinks and 4.5-5mL of Statorade, but in the smaller wheel the passive loss was measurably high, so I removed about 1/3 of the Statorade. The wheel still has greater drag than is ideal for an unpowered bike, but now the drag force is tolerable, though still noticeable. I suspect that I enjoy little if any benefit from the Statorade with only about 3 mL installed. Since I run most of the time with the motor powered while I pedal, the additional drag is a theoretical inconvenience, realized only if and when I find myself pedaling the bicycle a signficant distance while unable to produce motor power.
I ran my fourth trial with the 406 wheel installed on the same bike over the same course under conditions as close to the same as I could control, and I made some interesting discoveries:
In short, performance and efficiency was improved all around. It's clear to me that less heat is generated in the 406 wheel because the motor is operating at a more efficient point on its power curve. When using the motor as a brake, the controller is able to regenerate more and plug less, which is another way of saying that more of the recovered energy is converted into battery energy and less into heat. This is a good thing.
That the motor operates with greater efficiency in a smaller wheel leads me to wonder why we don't see direct-drive hub motors of similar design but with 125% the number of poles, giving the 559 wheel the same electrical RPM at the same speed as a 406 wheel. Most direct-drive hub motors use 23 poles, suggesting that similar improvement can be enjoyed with the larger 559 wheel laced around a direct-drive hub motor with 29 poles.
Since I made the above tests I have made some changes to the assist systems that I run on both of my bikes:
Overall the WCE version of this motor with the XT150 connectors is slightly more efficient than the Edge1500, especially when using the low turn count motor in the hills, when the controller must handle high currents. I have been using this motor on all of my e-bikes for the last few years and no longer spend much time tinkering or experimenting. For the kind of biking I like to do this system works well, and because both motor and controller are overrated by about a factor of two for the use I put them to, the system is extremely reliable.
†Elastic bending means that the dropouts return to their former width after the wheel is removed. The rear triangle has not been permanently (plastically) cold set to an increased width.
Endless-Sphere Forums - If you're looking for an answer to an obscure question related to ebikes, chances are someone following this forum knows the answer. If you're just getting into riding or building ebikes, spend a few days browsing through the forums. The only downside to this site is the sheer volume of data, and it can sometimes take a while to find a succinct answer to your question.
Grin Technologies - Electric Bike parts vendor and manufacturer in Vancouver, B.C. Known for their widely-used CycleAnalyst cycle meter. Good articles on the products they carry and an excellent modeling app for those designing an electric hub motor assist system for their bike.
ElectricBike.com - A nicely assembled blog on electric bikes. Included are news, reviews, and history of electric bikes.
EM3ev - English-speaking vendor based in China who sells e-bike parts and kits at competitive prices. Started out selling quality e-bike batteries but has recently added kits and other e-bike parts to his inventory.
All web site content except where otherwise noted: ©2026 Bill Bushnell
Background texture courtesy of Iridia's Backgrounds.
Please send comments or questions to the .