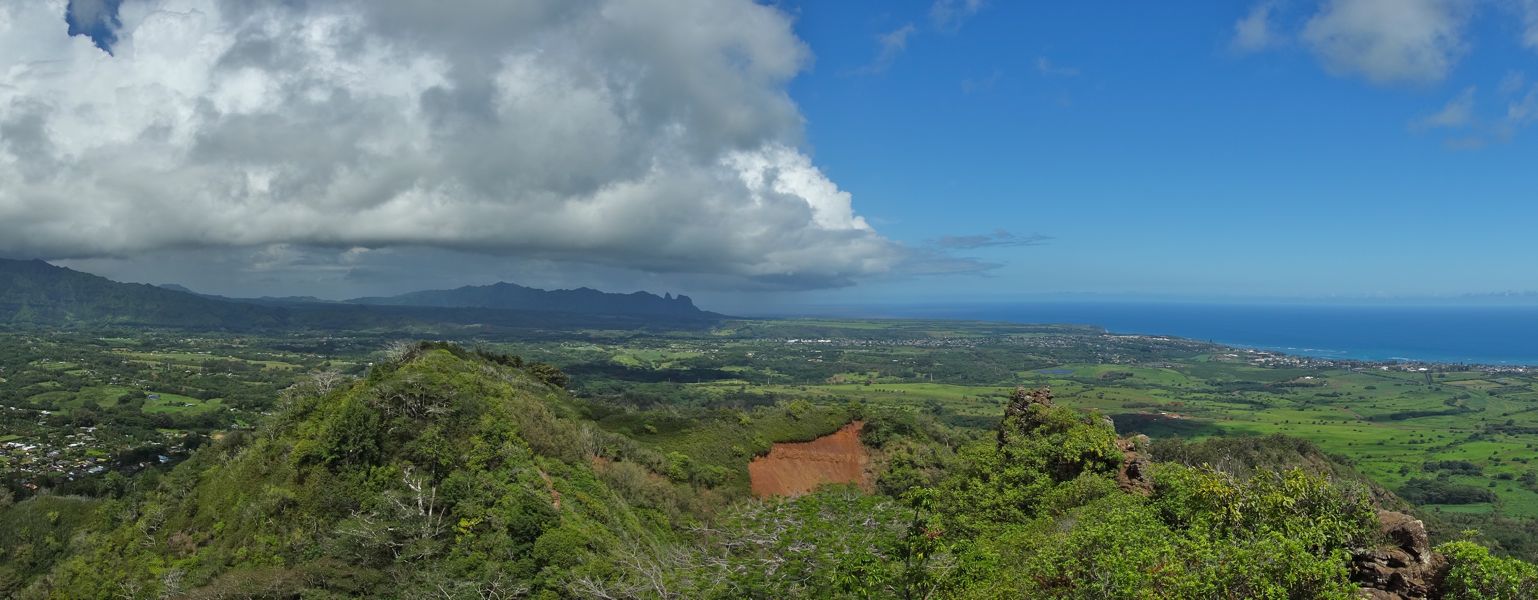
View North from Sleeping Giant - 10/2013
Reload page to see different photo.

The graph is distributed in a PDF file and can be opened and viewed using Adobe's Acrobat Reader or equivalent. For best printed results one's printer should have a minimum 600 dpi resultion.
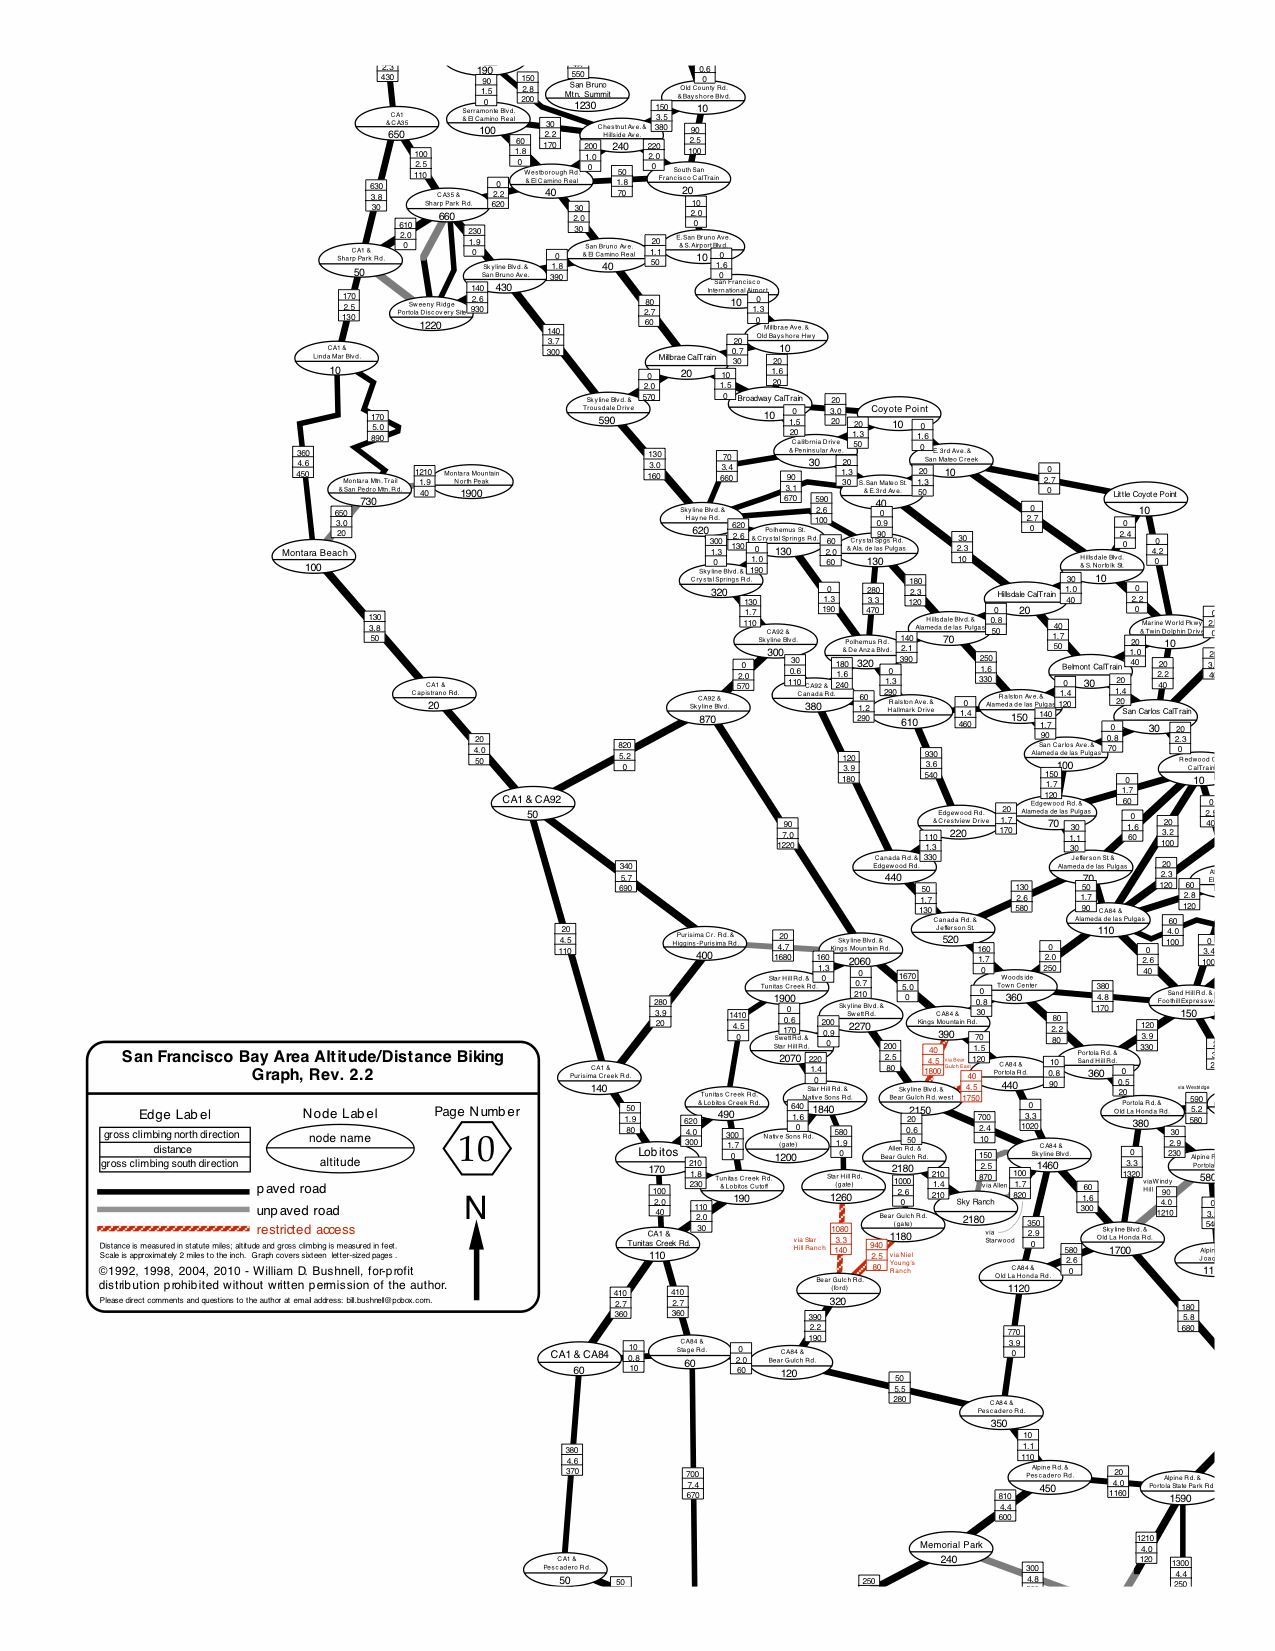
The graph is constructed as a connected network of nodes and arcs where nodes represent major points of interest or major intersections in the San Francisco Bay Area, and arcs represent the most direct route by road or trail between the two adjacent nodes.
This graph is intended to be used in conjunction with a normal street or trail map so that a named road or trail can be found, particularly where more than one plausible route exists for a given arc. This graph can be used to construct routes such that the distance and the gross climbing can be calculated directly.
The data in this graph formed the initial data set for the excellent software package, Klimb, created by Keith Vetter.

|
| Download Graph |

All web site content except where otherwise noted: ©2026 Bill Bushnell
Background texture courtesy of Iridia's Backgrounds.
Please send comments or questions to the .